CT OM EEG TM MIU 9/14
 ctomeegmiu43.jpg |
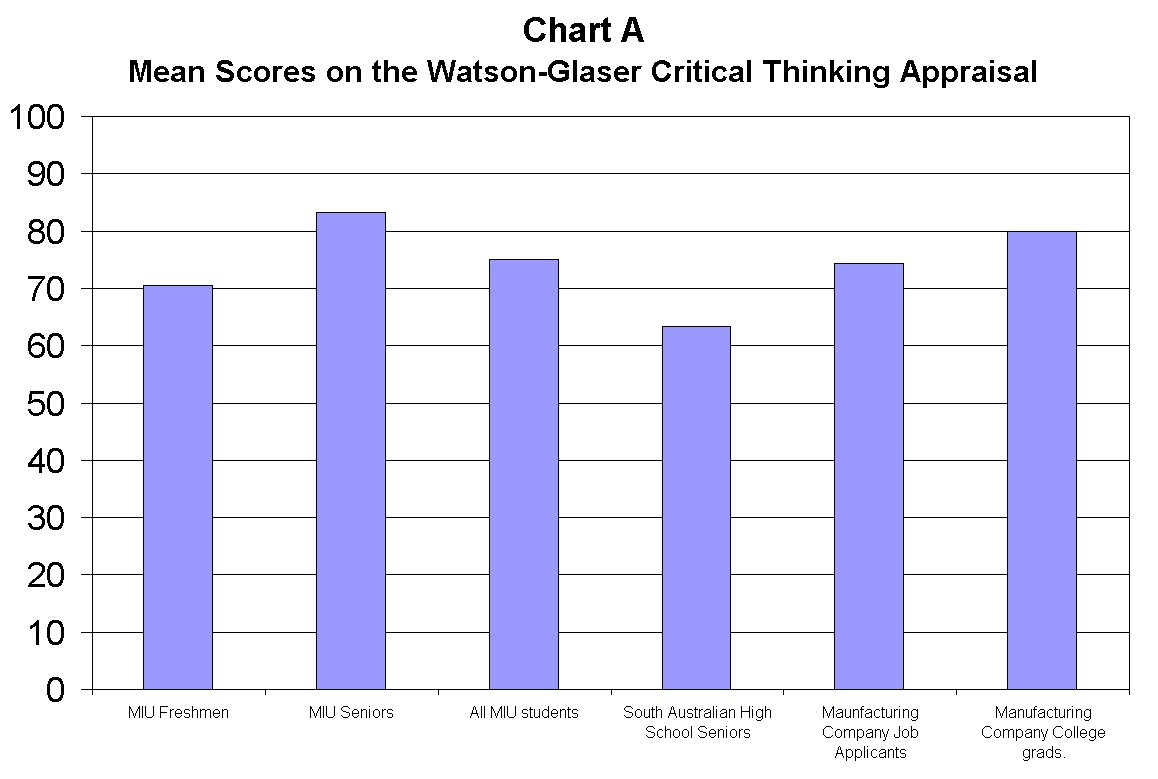
The second hypothesis was that MIU freshmen would not perform significantly different from established norms for other liberal arts freshmen. This hypothesis was tested using the table of norms (Table 1c) in the Watson-Glaser Critical Thinking Appraisal Manual. The percentile ranks in this table were based on results from 5,297 freshmen at 15 liberal arts colleges in 13 states. According to this table, the mean score on the WGCTA of 70.53 would place the average MIU freshman score in the 45th percentile, slightly below average. The freshmen WGCTA was also tested against the mean score for South Australian high school seniors (Lucas, 1972) by a t-test and no significant difference was found. These two methods of comparison led to the confirmation of the second hypothesis. The third hypothesis was that MIU seniors
would
outperform established norms for liberal
arts college
seniors. This hypothesis was tested using
the Table 1d
in the WGCTA Manual. The percentile ranks
for this table were obtained in a study with 554
first-semester senior
women at ten liberal arts colleges for
women in seven
states (Haas, 1963). According to this
table, the seniors'
mean score of 83.17 would place the average
MIU senior in
the 83rd percentile. Seniors at MIU were
thus higher in CT
with respect to their peers, than MIU
freshmen were. |
|||||||||||||||||||||||||||||||||||||||||||||||||||||||||||||||||||||||||||||||||||||||||||||||||||||||||||||||||||||||||||||||||||||||||||||||||||||||||||||||||||||||||||||||||||||||||||||||||||||||||||||||||||||||||||||||||||||
 ctomeegmiu44.jpg |
Table 3 Correlations between the
|
|||||||||||||||||||||||||||||||||||||||||||||||||||||||||||||||||||||||||||||||||||||||||||||||||||||||||||||||||||||||||||||||||||||||||||||||||||||||||||||||||||||||||||||||||||||||||||||||||||||||||||||||||||||||||||||||||||||
 ctomeegmiu45.jpg |
Table 3a Comparison of Subtest Intercorrelations and
Key
|
|||||||||||||||||||||||||||||||||||||||||||||||||||||||||||||||||||||||||||||||||||||||||||||||||||||||||||||||||||||||||||||||||||||||||||||||||||||||||||||||||||||||||||||||||||||||||||||||||||||||||||||||||||||||||||||||||||||
 ctomeegmiu46.jpg |
The mean WGCTA scores for seniors were also
compared
with mean scores provided in Table 2 in the
WGCTA Manual.
This table showed scores from job
applicants at a manufacturing
company, and from employees who were
college graduates. The
MIU seniors significantly outperformed the
job applicants
(t=3.31, df=60), and outperformed the The fourth hypothesis stated that the
subtests of the
Watson-Glaser Critical Thinking Appraisal would correlate
significantly with the total score as
shown by Table 3,
all subtests correlated positively with the
total score,
and with each other. Thirteen out of the
fifteen possible
combinations were statistically significant
positive
correlations. The correlations between
Evaluation of
Arguments and Inference, and between
Deduction and
Recognition of invalid Assumptions were not The correlation between the total WGCTA score and Interpretation of arguments was the highest value�(r=.85) which was also the highest correlation in the correlational matrix for norms provided in the WGCTA Manual (Watson-Glaser, 1964, p.15). Thus the fourth hypothesis was not completely accepted, due to the positive, but not significant values. |
|||||||||||||||||||||||||||||||||||||||||||||||||||||||||||||||||||||||||||||||||||||||||||||||||||||||||||||||||||||||||||||||||||||||||||||||||||||||||||||||||||||||||||||||||||||||||||||||||||||||||||||||||||||||||||||||||||||
 ctomeegmiu47.jpg |
Table 1 Watson-Glaser Critical Thinking
Table 2 Rokeach Adult Dogmatism Scale
|
|||||||||||||||||||||||||||||||||||||||||||||||||||||||||||||||||||||||||||||||||||||||||||||||||||||||||||||||||||||||||||||||||||||||||||||||||||||||||||||||||||||||||||||||||||||||||||||||||||||||||||||||||||||||||||||||||||||
 ctomeegmiu48.jpg |
|